|
An inventory of landuse and land cover is important for planning and management activities. Therefore, comprehensive information on the spatial distribution of landuse/land cover categories and the pattern of their change becomes a prerequisite for planning, utilization and management of the land resources of the country. The term land use relates to the human activity associated with a specific piece of land and depending upon the level of classification these landuse practices are determined using aero-space remote sensing (Lillesand & Keifer, 1987). Remote Sensing techniques have demonstrated their potential in providing information on the character and distribution of various natural resources, their depletion, degradation and contaminations. Hence, baseline information on land use pattern is a prerequisite for identification, prediction and evaluation of impacts on physico-ecological and socio-economic environment. Remote Sensing data in conjunction with the ground work and ancillary data is useful in obtaining baseline information of land cover and land use and can play an important role in Environmental Impact Assessment (EIA) and decision making related to the developmental projects like Narmada Sagar and Omkareshwar Dam projects.
A vegetation survey in inhabited areas cannot neglect land use practices in the area and their classification. The functional aspects are of high value for the vegetation mapper, who is concerned about the - explanation of the vegetation cover pattern and the application of the survey results (Kannegieter, 1988).
The major purpose of land use mapping is to know underlying causes/reasons for the present situations like area under particular crops, for monitoring crop condition and development and management of land use due to certain management/conservation policies or the lack thereof, the location of illegal dumping, deforestation and encroachment.
Remote Sensing technology has been widely used either in mapping alone or in combinations like land cover/land use mapping, vegetation/landuse mapping etc. Different aero-space remote sensing data like different kinds of medium to large scale photographs, satellite data with higher resolution and scale (1 :50,000) are available for landuse mapping. Landuse mapping on national level (Anonymous, 1989) for coal fields in Jharia (Ghosh & Ghosh, 1990), land use change analysis of Bharatpur district (Dhinwa et al. 1992), Vegetation and land use analyses of Aglar watershed (Pant and Roy, 1990), Forest cover and land use mapping in Karbi Anglong and North Cachar hills of Assam district (Roy and Das. 1991) have been done using remote sensing techniques.
5.1 OBJECTIVES
Mapping and monitoring of developments in landuse as a result of construction of dams and declaration of the protected areas in Narmada Sagar and Omkareshwar Project areas.
5.2 METHODOLOGY
5.2.1 Landuse Classification
Landuse and land cover classification primarily deals with man's activities on land and can be expressed in terms of 'formal' use or 'cover' on the land surface e.g. buildings, crops, grasslands, forests, bare rocks etc. (Kannegieter, 1988). Level of information on landuse obtainable on the imagery is dependent on scale and spatial resolution of satellite data, because the reflected/emitted energy reaching to the sensors is the combined response of the features falling within each grid or pixel. Using SPOT (MLA) data with 20 X 20 m ground resolution, interpretation has been done on 1 :50000 scale in the present study. With 20x20 m ground resolution the minimum size of mappable unit on ground is 2.25 ha.
Anderson's classification system (commonly called as USGS system) suits specially to the remote sensing data (Anderson et al., 1976). NRSA in consultation with user organisations including Planning Commission has developed a comprehensive classification system for National Landuse I Land cover classification system. Following their classification scheme, nine categories have been identified on satellite data in conjunction with ground truth. It would have been more appropriate to use two season data (Rabi and Kharif crops) to know the areas under single and double cropping. Using a single season data the following categories have been discriminated. Table 12 provides the interpretation key for discrimination of these categories on SPOT MLA on 1:50,000 scale.
1. Forest area 2. Scrub/shrub
3. Grasslands 4. Riparian
5. Barren/rocky/Blank 6. Agriculture with crop
7. Agriculture without crop 8. Water body
9. Sand
5.2.2 Ground check
(same as for vegetation mapping)
5.2.3 Finalization of mapping
(same as for vegetation mapping)
5.2.4 Creation of database
(Procedure similar to vegetation map)
Table 12 : Interpretation Key for Landuse Mapping on SPOT (MLA)
Image on 1:50,000 Scale
| Type |
Tone |
Texture |
Association |
Pattern |
Shape |
| Forest area |
Light pink, Brown-dark Brown to red |
Smooth to coarse |
Everywhere |
Contiguous |
Irregular |
| Scrub/Shrub |
Blackish cyan |
Smooth to medium |
Ridges, hill top |
Scattered |
Irregular |
| Grassland |
Whitish Yellow |
Smooth |
Forested areas |
Scattered |
Narrow elongated strips on hill top |
| Riparian |
Black brown |
Smooth |
Riverbeds |
Contiguous |
Valleys or riverbed |
| Barren/Rock |
Light to dark |
Medium |
Inside the |
Scattered |
Oval to Elongate |
| Blank |
cyan |
|
forest valleys |
|
|
| Agriculture |
Light pink to bright pink |
Smooth |
Valley plains black soil |
Contiguous |
Rectangular With crops in definite shapes |
| Agriculture without crop |
Grey to dark black |
Smooth |
-do- |
-do- |
Irregular |
| Waterbody |
Light to dark blue to black |
Smooth |
River course |
Contiguous |
Linear |
| Sand |
White |
Smooth |
Riverbed |
Scattered |
Irregular |
5.3 RESULTS AND DISCUSSION
To deal with the present challenges in terms of natural resource planning and management the baseline information is of utmost importance, Remote Sensing technology can provide timely, accurate and up-to-date information on the landuse/land cover at the shortest possible time, low cost and less man power. Remote Sensing technology has been found very useful in area estimation for single and double cropped lands. Change in landuse practices can be known by multidate data and trends can be predicted. Encroachment into forested land is a very serious landuse change which has resulted in shrinkage of forest. By declaring the PPAs, changes in landuse are likely to occur. For example, once the proposed PAs are gazetted the agricultural activity would stop. These agricultural lands are mostly in the flat valleys and are highly productive. These areas can be planned and managed to develop into grasslands. Grasslands are vital for herbivores in the PPAs. Remote Sensing technology can play vital role in the monitoring of changes in landuse as these result from certain management/conservation policies or the lack of thereof, such as urbanization, deforestation, erosion, salination, desertification, waterlogging, but also land reform, reforestation and impact of introducing new crop types/varieties, management practices (Kannegieter, 1988 ).
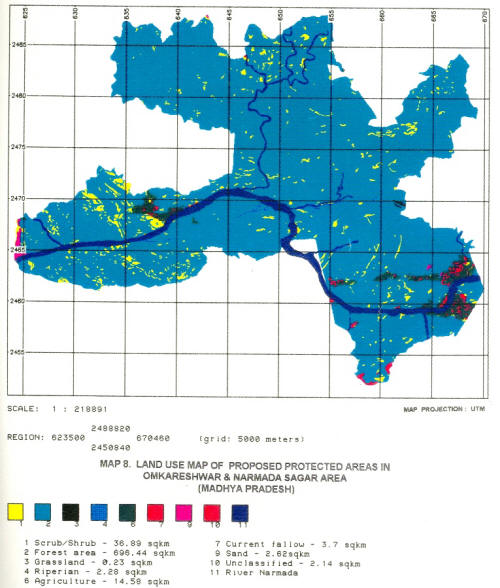
It is obvious from above discussion that remote sensing can playa very important role in the generation of baseline data for resource planning, management and monitoring. The utility of the land use maps depends on the level at which the objects have been classified. A multilevel system has been devised for different degrees of details which can be obtained from different Remote Sensing systems and image resolution. Level I classification is required for planning at the state or national level and for micro level planning information at level II and III are required. The PPAs covering the parts of two forest divisions have been interpreted on satellite data for level II information (Map 8).

Landuse map prepared using SPOT MLA (1:50,000 scale) has following nine categories. Standard techniques for visual interpretation have been adopted and imagery have been interpreted based on tone/colour, texture, pattern, shape etc. Following are the detailed description of each category:
(1) Forest (Dry Deciduous Forest)
Teak is the main constituent of the PPAs. Other dominant species which occur scattered to gregarious depending upon the edaphic factor and moisture content are Boswellia serrata, Hardwickia binata, Lannea coromandalica, Terminalia tomentosa and Acacia spp. Holarrhena pubescens, Nyctanthes arbor-tristis, Cassia tora, Ocimum spp. etc. are some of t\1e elements from ground flora. Forest type is dry deciduous and leaf fall starts from November onwards.
On satellite data (FCC) the forests appear in different tones of red. Depending upon the canopy closure and plant form these appear dark brown to black (Hardwickia and its associates), dark red to pink red (Teak and its associates).
(2) Scrub/Shrub:
Due to biotic pressure and also edaphic factors sites have degraded. Those on the hill tops with plenty of stones and rock outcrop are with Holarrhena pubescens, Zizyphus spp, stunted growth of grass tufts, stunted Tectona grandis, Anogeissus latifolia etc. The cleared forest where regeneration has not been possible due to grazing pressure have Ocimum americana and Cassia tora.
On satellite data these areas appear blackish cyan to light cyan in tone. Texture is smooth to medium in some areas. In the Nimanpur R.F. most of the hill tops along Narmada river have such types of areas.
(3) Grasslands:
Grasses grow on the sites where the site has been subjected to some biotic pressure. On soils having medium size stones grasses may grow up to 1 m height. Grasses are also found as ground flora,. in less dense forest. Dominant grasses are Apluda spp, Themeda quadrivalvis, Aristida spp and Heteropogon contortus and occur on hill tops.
On satellite image these areas appear as whitish yellow tone. Texture is smooth. Such areas are very few.
(4) Riparian Forest:
Riparian forests occur along the deep and moderately deep streams, rivulets, therefore, such : areas are narrow and linear. Soils are deep where the eroded clay and loam from upper reaches are deposited whereas on steep slopes stream beds are rocky. Terminalia arjuna, Eugenia spp, Ficus spp. etc. are the common characteristic species. Bamboo grows in association with trees (Plate 7).
On satellite data these areas appear black brown and texture is smooth. Narrow bands of such forests can be traced along the streams.
(5) Blank/Barren/Rock:
Rocks are exposed in the Narmada river bed. In PPAs there are numerous small scattered blank patches in the forested areas.
Such areas appear light to dark cyan on satellite image. Texture is medium. High dip slopes are without good tree growth.
(6) Cropped Land
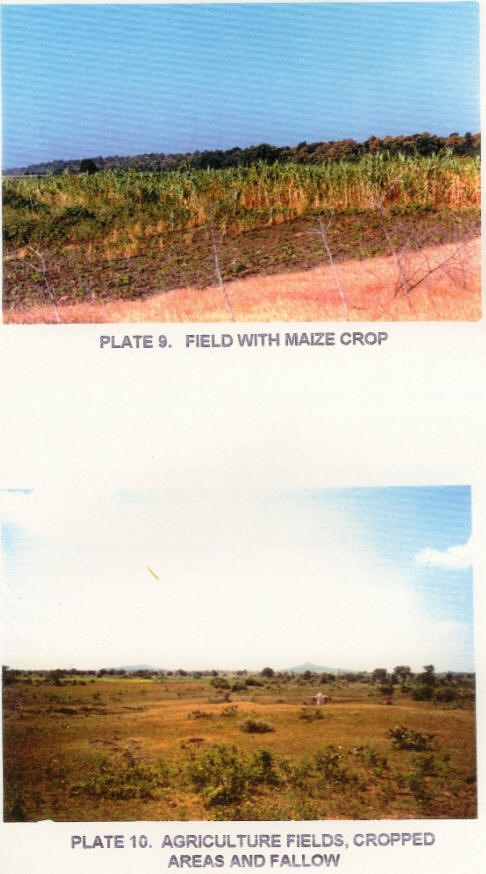
Satellite data interpreted in the study was of November, 1988 and therefore crops of "Rabi Season" have been mapped as agriculture fields with crop. Major crops are Cotton, Wheat, Barley, Bengal gram and Arhar (Plate 9).
On satellite data cropped areas appear in the tones of light pink (dull) to bright pink. These can easily be separated from surrounding forest areas because of their regular shape. Small fields are usually associated with habitation and fallow land.
(7) Fallow Land
Here current fallow lands have been called as Fallow. These lands are associated with cropped fields and habitation (Plates 9 and 10).

On satellite imagery these appear from dull pale to whitish yellow to dark black. The ploughed fields without crop appear black. Narrow strips of cultivation in valleys inside the forest often confuse the interpreter, hence ground truth should be done in such areas.
(8) Waterbody:
There are natural as well as man-made waterbodies in the project area. The Narmada river and its perennial tributaries are natural water body. On the northern bank is Khari Nadi and on southern bank is Chhota Tawa river. Areas with water appear light to dark blue to blackish blue on satellite data. Texture is smooth.
(9) Sand:
Sand occurs on the banks of the river and rivulets. In the forested areas though the soil is sandy, sand does not form any marked feature.
Depending upon the moisture content in the sand, it appears white (dry sand) to light cyan to cyan (with water content). Texture is smooth. Such areas are associated with islands in river beds or on the banks.
5.3.1 Area Estimation
Area analysis has been carried out using GRASS GIS package. Following are the area details (Table 13) in the PPA.
The PPAs have 91.5% (694.44 km2) of forest area. Majority of the area has good forest. About 4.8% (36.89 km2) of the total area under PPAs is with Scrub/Shrub. Agriculture area is 14.58 km2 (1.92%) only.
Table 13. Area under different landuse categories
| S.N. |
Category |
Area(sq km) |
Area % |
| 1. |
Forest |
694.44 |
91.50 |
| 2. |
Scrub/Shrub |
36.89 |
4.86 |
| 3. |
Agriculture |
14.58 |
1.92 |
| 4. |
Current Fallow |
3.70 |
0.48 |
| 5. |
Riparian |
2.28 |
0.30 |
| 6. |
Grassland |
0.23 |
0.03 |
| 7. |
Sand |
2.62 |
0.34 |
| 8. |
Unclassified |
2.14 |
0.28 |
5.3.2 Area Analysis of PPAs
5.3.2.1 Proposed Omkareshwar Sanctuary
Area analysis of landuse pattern in the proposed Omkareshwar Sanctuary indicates that out of 119.96 km2 of geographical area, 98.82 km2 (82.37%) is forested area (Dry Deciduous Forest). Scrub/Shrub forms 11.97% (14.36 km2) of the total area. Agriculture area with crops is about 3.99 km2 (3.33%) and current fallow land is 0.55 km2 (0.48%). Table 14 provides landuse details for Omkareshwar Sanctuary. A little part of the sanctuary will be inundated due to Omkareshwar dam.
Table 14. Landuse pattern in the Proposed Omkareshwar Sanctuary
| S.N. |
Category |
Area(km2) |
Area (%) |
| 1. |
Forest |
98.82 |
82.37 |
| 2. |
Scrub/Shrub |
14.36 |
11.97 |
| 3. |
Agriculture |
3.99 |
3.33 |
| 4. |
Current fallow |
0.55 |
0.46 |
| 5. |
Riparian |
0.08 |
0.07 |
| 6. |
Grassland |
0.00 |
0.00 |
| 7. |
Sand |
2.04 |
1.70 |
| 8. |
Unclassified |
0.12 |
0.10 |
| Total |
119.96 |
100.00 |
5.3.2.2 Proposed Narmada National Park
The Proposed Narmada National Park, as per current assessment is going to be a very good area for teak forest. Hardwickia, a species with disjunct distribution will be protected for better regeneration. In Narmada National Park, area under Forest (Dry Deciduous Forest) is about 439.94 km2 (92.57%), of the total area (475.22 km2). The condition of the forest and large contiguous patch will help in biodiversity conservation. Scrub/Shrub covers an area of 16.66 km2 (3.5%). A good extent of agriculture area i.e. 13.69 km2 (2.87%) needs management attention in the Chandgarh Forest range, once these villages are rehabilitated. Of this 10.54 km2 (2.22%) was shown in rabi season and 3.15 km2 (0.66%) is as current fallow or without crop. Of the three PPAs, the national park will have maximum submergence due to Narmada Sagar dam. Table 15 gives the area analysis of the different land use classes in the proposed park.
Table 15. Landuse Pattern in the Proposed Narmada National Park
| S.N. |
Category |
Area (km2) |
Area (%) |
| 1. |
Forest |
439.94 |
92.57 |
| 2: |
Scrub/Shrub |
16.66 |
3.50 |
| 3. |
Agriculture |
10.54 |
2.22 |
| 4. |
Current fallow |
3.15 |
0.66 |
| 5. |
Riparian |
2.20 |
0.46 |
| 6. |
Grassland |
" 0.23 |
0.04 |
| 7. |
Sand |
0.52 |
0.12 |
| 8. |
Unclassified |
1.98 |
0.41 |
| Total |
475.22 |
99.98 |
5.3.2.3 Proposed Surmanya Sanctuary:
The proposed Surmanya Sanctuary is being proposed as a buffer to reduce biotic pressure in the National Park. While proposing the sanctuary, care has been taken to exclude all the villages. This protective strip would form the northern boundary of the proposed National Park.
The area also has good dry deciduous forest covering an area of about 157.68 km2 (96.32%). Scrub/shrub is only 5.87 km2 (3.88%) and other land use classes are very less in this area. No part of this sanctuary will be affected by the submergence. Table 16 provides the area details of the landuse classes.
Table 16. Landuse pattern in the Proposed Surmanya Sanctuary.
| S. N. |
Category |
Area (km2) |
Area (%) |
| 1. |
Forest |
157.68 |
96.32 |
| 2. |
Scrub/Shrub |
5.87 |
3.58 |
| 3. |
Agriculture |
0.05 |
0.03 |
| 4. |
Current fallow |
0.00 |
0.00 |
| 5. |
Riparian |
0.00 |
0.00 |
| 6. |
Grassland |
0.00 |
0.00 |
| 7. |
Sand |
0.06 |
0.03 |
| 8. |
Unclassified |
0.04 |
0.02 |
| Total |
163.70 |
99.98 |
|


